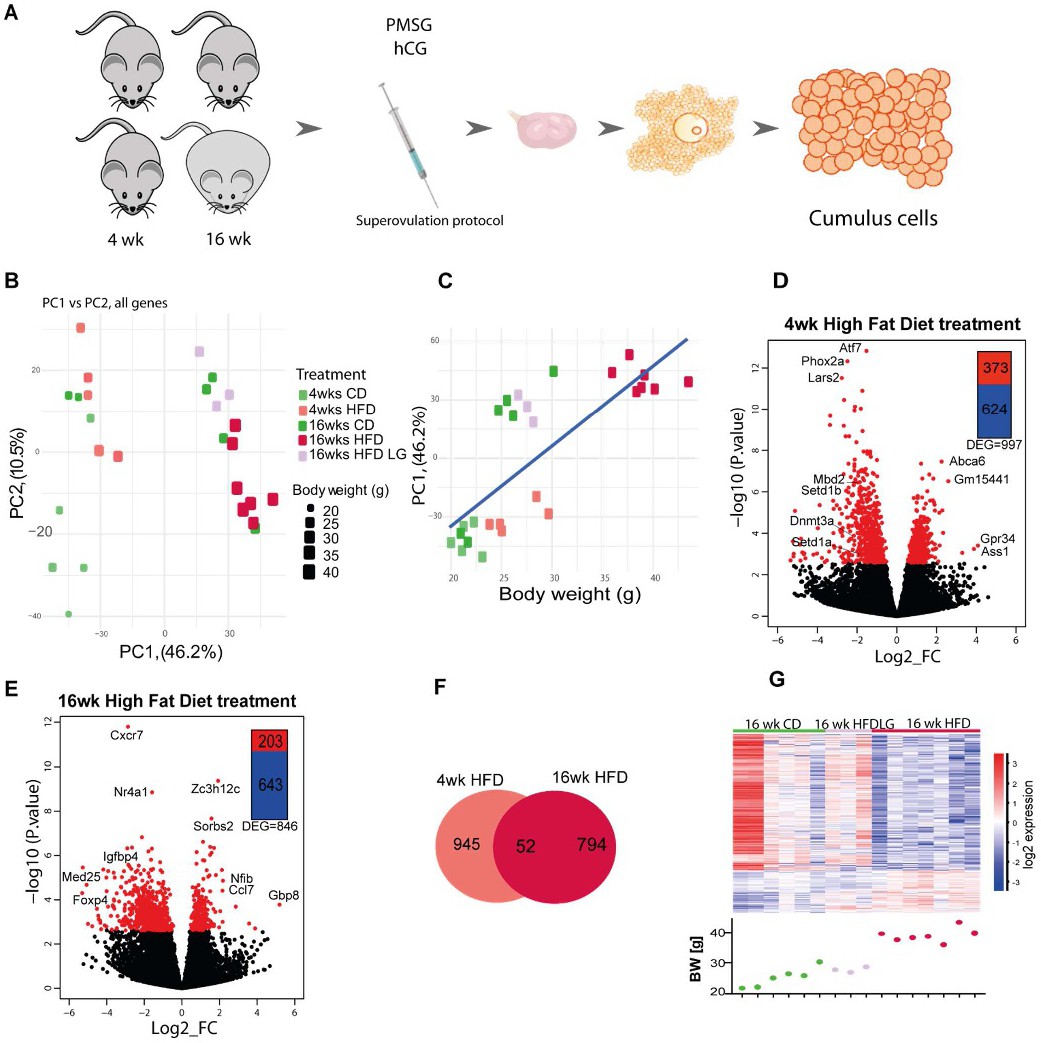
Fig. 2. Cumulus cell transcriptome analysis in diet induced-obese mice reveals strong correlation with body weight. (A) Experimental design: mice were subjected to the indicated dietary protocol, superovulated and cumulus cells were collected from cumulus-oophorus-complexes. RNA-seq analysis of gene expression in cumulus cells obtained from mice after 4 or 16 weeks (wk) on chow diet (CD), high fat diet (HFD) or low gainers on HFD (HFDLG). N= 3-7 mice per group. (B) Principal component analysis of global transcriptome shows samples cluster into 2 groups accordingly to their body weight (BW). (C) Correlation of Principal Component 1 (PC1) with BW; r=0.777, p=3.026e-06. Volcano plots showing distribution of differentially expressed genes in (D) 4 wk HFD and (E) 16 wk HFD; genes with false discovery rate (FDR) <0.05 colored red. (F) Venn diagram showing the number of genes differentially expressed at false discovery rate <0.05 between 4 wk and 16 wk groups. (G) Heatmap of 846 DEGs identified by DESeq2 analysis between 16 wk CD and HFD CCs, including data for HFDLG CC samples, with BW of mice at time of collection plotted below. Heatmap representing fold of change of gene expression. log2_FC of reads per million (RPM).